Research · 2025–26

Team
Research

Three papers written by our team during the 2025–26 cycle: the engineering behind this year's pod, the control theory of keeping it levitated at speed, and the case for hyperloop on a real European corridor. Plus every newsletter and announcement from the team.

Index

Papers & News

Our research papers alongside every newsletter, flyer, and announcement, by academic year. Papers open their full write-up below; everything else opens full size.

2025–26 AY-25-26
Read Paper 01 · May 2026 Engineering Design Document Read Paper 02 · Jun 2026 Dynamics-Aware Maglev Control Read Paper 03 · 2026 Amsterdam–Berlin Corridor
2024–25 AY-24-25
Engineering Design CH-EDD-26

Engineering Design Document

The 2025–26 design cycle moved the pod away from heavy, off-the-shelf industrial hardware toward a custom-engineered, modular system that is lighter, smaller, and easier to build.

The document walks through all eight subsystems: a press-fit aluminum chassis, switchable magnetic and dual-sided pneumatic brakes, a parametrically optimized linear induction motor, custom levitation electromagnets, in-house power electronics, and a cloud-connected command-and-control stack.

62% Chassis mass reduction
65 lb steel to 25 lb aluminum
~120N Simulated LIM thrust
Custom mini-LIM, ANSYS Maxwell
<30min Chassis assembly
Two people and a rubber mallet
20× Faster LIM simulations
5+ hours down to 15 minutes
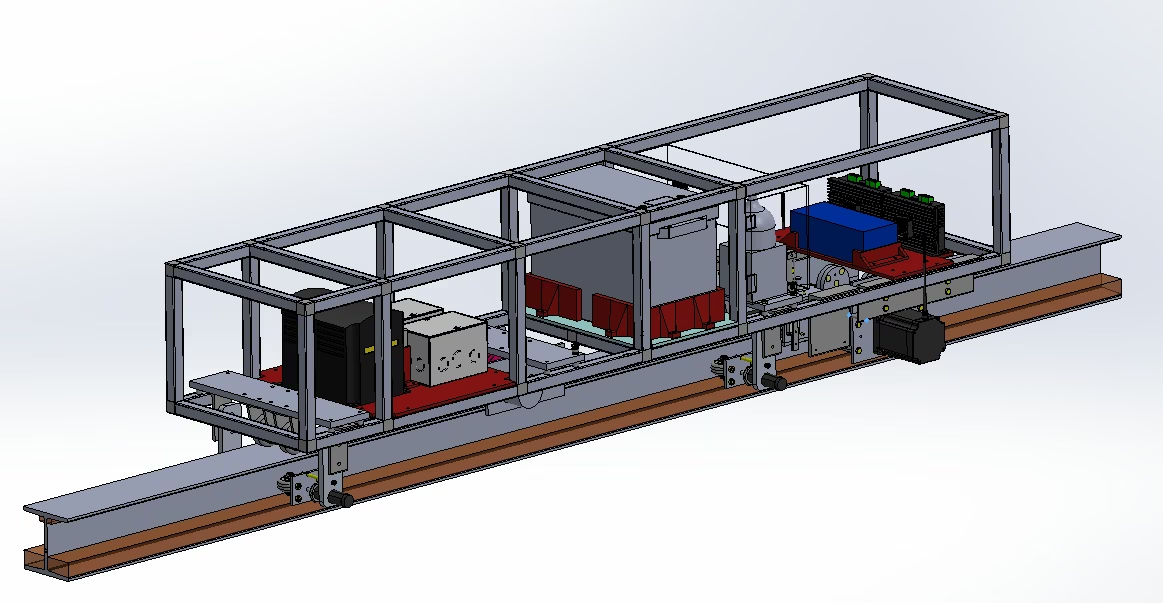
Fig. 01 — 2025–26 Pod Assembly CAD assembly of the 2025–26 pod: a two-layer modular aluminum chassis carrying power electronics, motor drivers, and brake actuators above an I-beam track
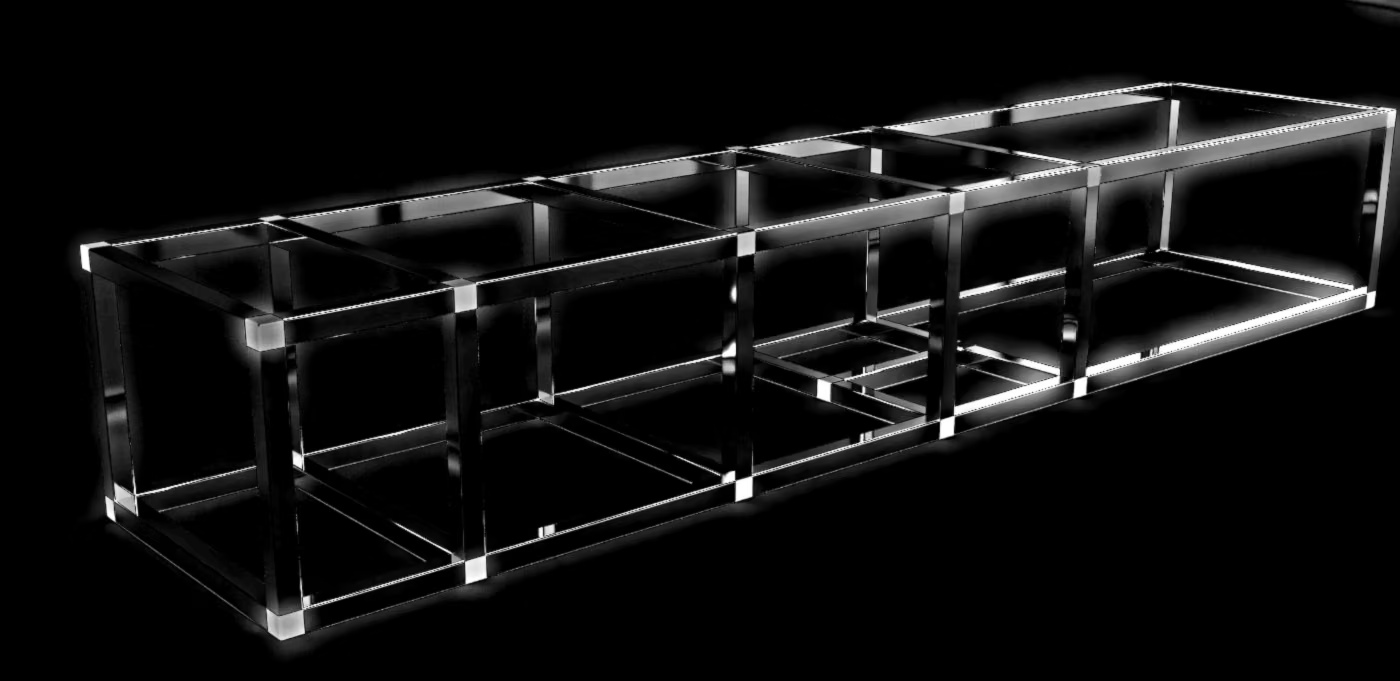
The SQ5 chassis: 6.1 ft long and 16 in wide, split into a lower layer for EMI-producing power electronics and an upper layer for sensors and control.
Technical Aspects · Controls CH-TA-26

Dynamics-Aware Control of Electromagnetic Levitation

for Hyperloop Pods Under Motion, Track Irregularity, and Transient Loading

Maglev pods are usually sized with a static force balance: magnetic lift equals pod weight. This paper argues that is where levitation design starts, not where it ends.

It builds a reduced-order model of a pod with front and rear levitation modules, coupling nonlinear magnetic force, finite coil-current dynamics, heave and pitch, speed-dependent track irregularity, eddy-current effects, and braking load transfer. Three controllers are then compared across the resulting operating envelope.

Static lift calculations can start the design, but they cannot finish it.

From the conclusion
  1. R1
    Hover is a weak testOn a flat guideway, every controller meets the static lift condition and holds the design gap. The differences only appear in motion.
  2. R2
    Speed turns track error into frequencyA guideway error of wavelength λ reaches the controller at f = v/λ. At speed, the same bump pushes into the actuator's bandwidth.
  3. R3
    Braking over a defect is the critical caseLoad transfer, pitch coupling, finite current response, and a local gap disturbance all arrive at once.
  4. R4
    The safe envelope is the metricStatic sizing sets the operating point. Closed-loop simulation sets the safe speed and disturbance envelope around it.
Controllers Compared
CTL-01

PID + Feedforward

A static feedforward current from the nominal force balance, corrected by local gap feedback at each module. Simple to validate and adequate near the operating point.

CTL-02

Coordinated Body Feedback

State feedback on heave and pitch together, so front and rear modules act as one body. Gains can be scheduled across speed, acceleration, and payload.

CTL-03

Constrained Nonlinear

Regulates the instantaneous gaps, allocates feasible module forces, and adds a soft clearance barrier near the hard gap. It earns its complexity once actuator limits become active.

Socio-Economic Aspects CH-SE-26

Hyperloop on the Amsterdam–Berlin Corridor

Can hyperloop outperform rail and aviation on a real, high-demand European route? This study tests the question on the ~575 km Amsterdam–Berlin corridor.

It combines a three-phase kinematic travel-time model, a comparative lifecycle-emissions assessment across hyperloop, rail, and aviation, and EU infrastructure cost benchmarks, then examines the conditions under which hyperloop could meaningfully help decarbonize intercity travel.

~50min In-tube travel time
At 700 km/h with 0.5 g acceleration
90–95% Lower emissions than flying
Lifecycle, per passenger
60–80% Lower than intercity rail
Same corridor, same functional unit
17–24B Infrastructure, EUR
Mixed elevated and tunneled build
Fig. 03 — Corridor Comparison
Amsterdam AMS · NL
Berlin BER · DE

Journey time

Hours, one way. Bars show the reported range.

Aviation
4.5–5 h
Intercity rail
~6 h
Budget rail
7–8 h
Hyperloop · 700 km/h
54–70 min
Hyperloop · 1,200 km/h
34–50 min

CO2 per passenger

Kilograms, one way across 575 km.

Aviation
88–147 kg
Intercity rail
17–24 kg
Hyperloop · today's grid
3.5–8 kg
Hyperloop · 2035 grid
1.7–4.6 kg

Source: figures as reported in the paper, drawing on Beckert et al. (2024), Ember (2024), and Ramboll et al. (2025). Hover or focus a row for its basis.

TIME

A same-day round trip

Sub-hour travel holds even at a gentler 0.3 g, which adds only 1.7 minutes. The real threat is terminal time: security and boarding have to stay within 10–15 minutes.

CARBON

Cleaner as the grid gets cleaner

Hyperloop already beats aviation on today's grid. Germany's energy policy and early occupancy (below ~50%, per-passenger emissions climb fast) are the swing variables.

COST

Tunnels drive the budget

Elevated track over flat terrain runs EUR 25–35M per km. The 40–60 km of urban tunnels add EUR 2.8–4.2B, with ~EUR 45M a year in maintenance.

Join the Team

Want to write next year's papers?